The organization dashboard allows admins to get an overview of the actions that are being taken by their employees within their Fliplet account.
Note: This feature is available for enterprise customers only
Features
The Organization Dashboard offers the following data regarding:
- Studio sessions
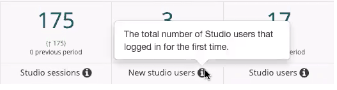
- New studio users
- Studio users
- Apps created
- Apps edited
- Apps published
- App sessions
- Total app users
- Unique app users
- Apps available
Get Started
To use the Organization Dashboard you’ll need to:
Step 1 – Open the Organization Dashboard
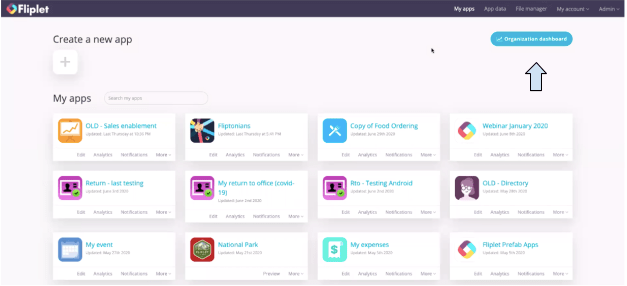
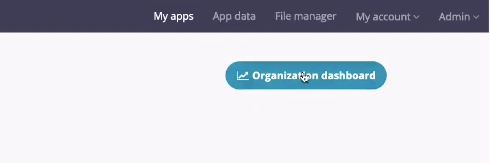
- In Fliplet Studio, click on the blue “Organization Dashboard” button in the top right.
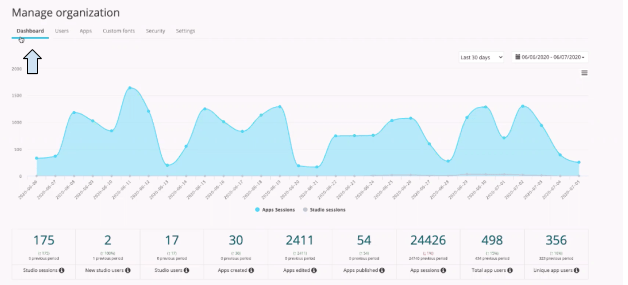
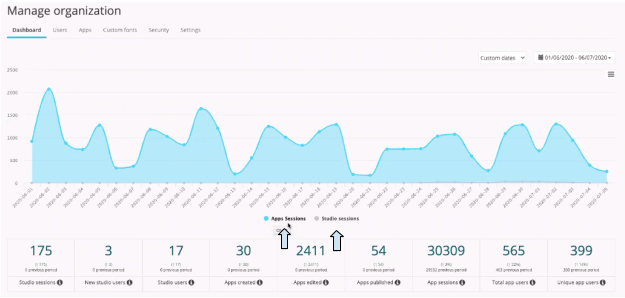
- In the Organization dashboard, Open the “Dashboard” tab in the upper left corner under “Manage organization”.
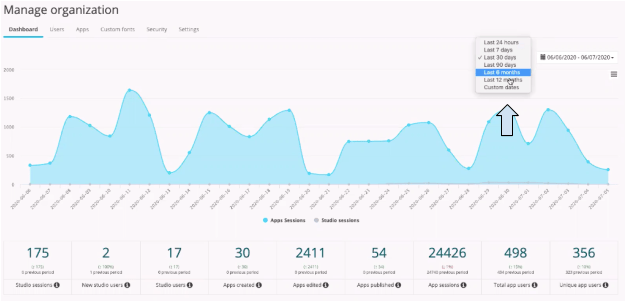
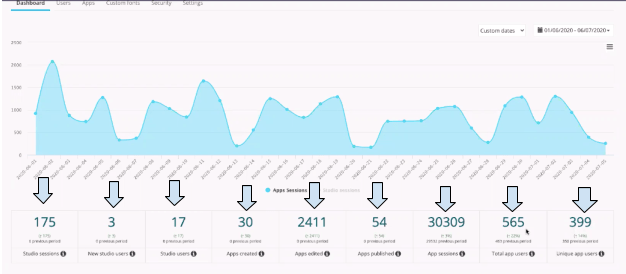
- In the dashboard you will see a graph displaying apps sessions over time. You can also set it to show studio sessions. The numbers below the graph represent different metrics discussed in greater detail in the steps below.
Step 2 – Set the time frame
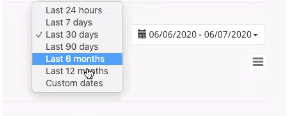
- In the Dashboard screen in the top right of the chart, click on the time frame that you want to see data for.
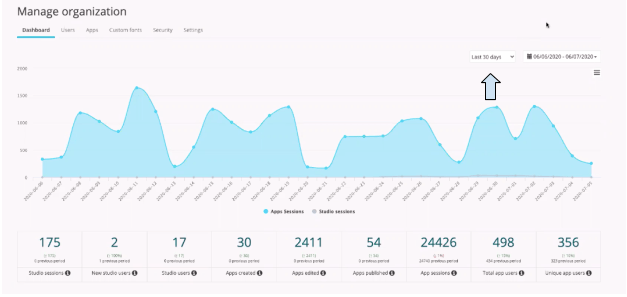
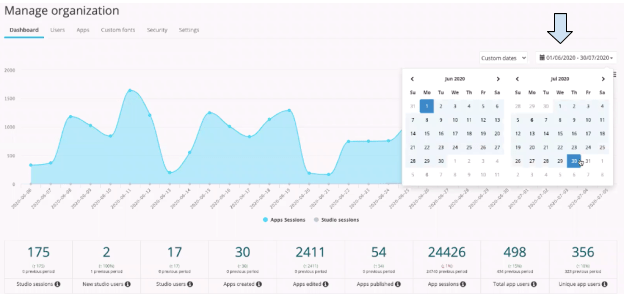
- Choose one of the preset time frames or select “Custom dates” from the dropdown to set your own time frame.
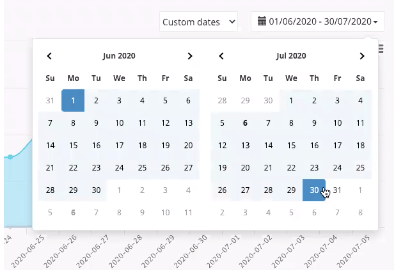
- If you choose “Custom dates” then to the right of the drop down, click on the dates to manually select them from the calendar.
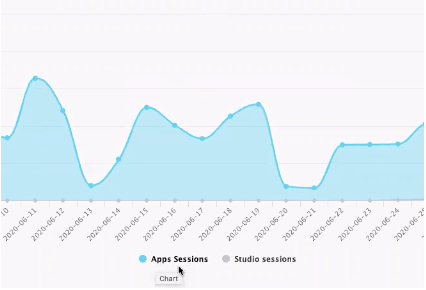
Step 3 – The Chart (Apps Sessions and Studio sessions)
- In the dashboard screen directly below the chart, you can choose to view chart data for “Apps Sessions” or “Studio sessions”.
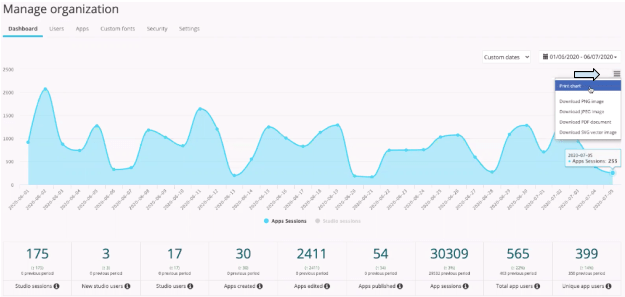
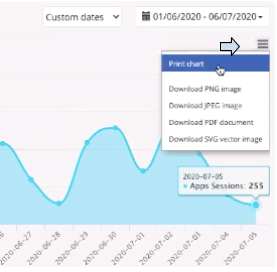
Category Definition Apps Sessions out of all of your live apps, how many times have they had an active session, or how many times have they been used in the set time period by anyone in your organization. Studio sessions how many sessions your organization has had in Fliplet Studio. - If you click on the menu icon in the top left of the chart, you can choose one of the following options: Print chart, Download PNG image, Download JPEG image, Download PDF document, or Download SVG vector image.
Step 4 – More data categories
- Below the chart in the dashboard section are the numbers for each category within the given time frame that you selected.

- Underneath the number is a bolded lowercase “i” icon. Hover over this icon to see a description of that specific category.

- Directly below the number (current period) is the number for the previous period.
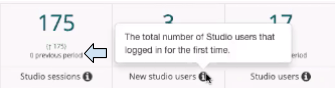
Category Definition Studio sessions the total number of studio sessions within your organization. A session is a group of interactions without 30 minutes of inactivity. New studio users the total number of Studio users that logged in for the first time within your organization. Studio users the total number of Studio users within your organization. Apps created the total number of apps created within your organization. Apps edited the total number of apps that had screens altered within studio by anyone in your organization. Apps published the total number of apps that had app updates published via Studio. App sessions the total number of sessions in the time period for the live app. Total app users the total number of users of all of your live apps. This includes logging in on a web link and phone app (so multiple logins in multiple ways with the same login info) Unique app users the total number of unique users - Here are all of the categories in the order they were listed above as they appear in the organization dashboard. Keep in mind the numbers will be different for your own organization.

Step 5 – More Information
- In the Dashboard screen, scroll down to view the information for Apps and Users.
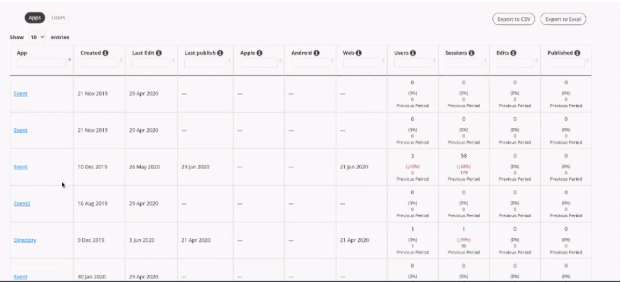
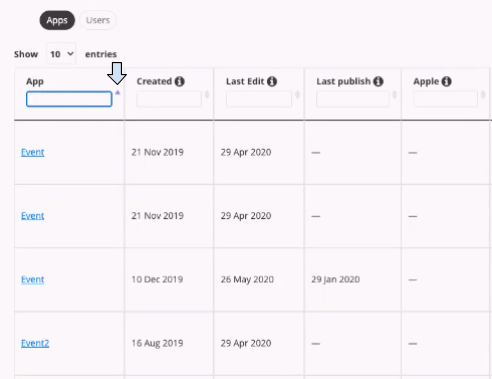
- The first column lists all of the different apps that have been created in your Fliplet account. Within the app category, you can search to find a specific app.
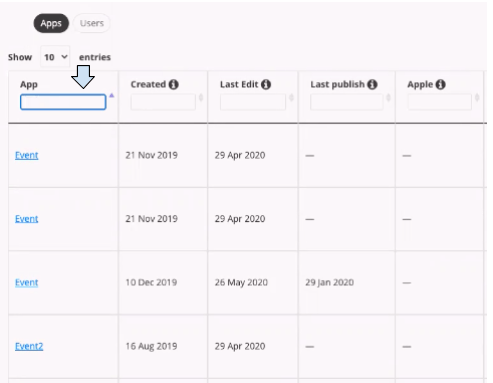
- If you click on the arrow next to the search bar you can filter the list.
- Hover over the “i” again to view the meaning of the different categories in the chart.
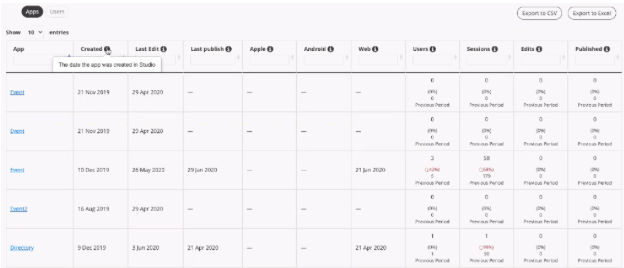
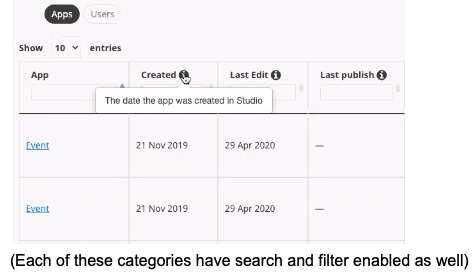
Category Definition Created the date the app was created in Studio. Last Edit the date a screen was last edited in Studio. Last publish the date an app update was last published in Studio. Apple the first time an app was built for iOS. (If it’s blank it means an app was never built for iOS) Android the first time an app was built for android. Web the first time an app was built for the web. (when an app has been built for the web you will see a date in the corresponding cell) Users The total app users across all apps. A user is a unique device, and, if the app has a login, a unique logged in user. Sessions the total number of app sessions. A session is a group of interactions without 30 minutes of inactivity. Edits the total number of times screens were edited in Studio. Published the total number of times an app was updated and published in Studio. 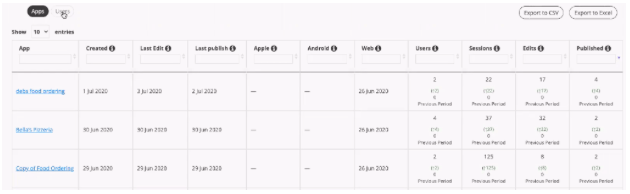
- You can also view a report for the Users in your Fliplet account by clicking the button above the table that says “Users”.
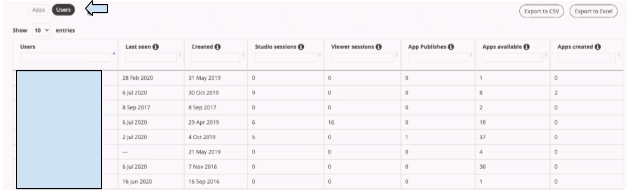
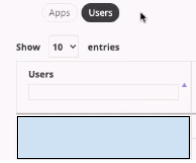
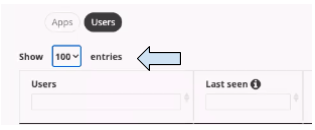
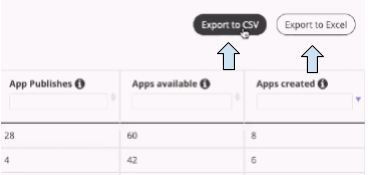
Category Definition Last Seen the users last login date. Created the date the user was created. Studio sessions the number of studio sessions the user has (how many times have they logged in.) Viewer sessions the number of Fliplet Viewer sessions the user has. App publishes the number of times a user has published an app updated in Studio. Apps available the number of apps the user has access to in Studio. Apps created the number of apps the user has created in Studio. - In the top left of the table you can choose how many entries you want to see.
- In the top right of the table you can click on the button to Export to CSV or Export to Excel.
Related Articles
Was this article helpful?
YesNo