Features
Fliplet Analytics shows the following usage data:
- Active devices
- New devices
- Sessions
- Screen Views
- Most popular screens
- Interactions
- Interactions per screen
- Most active users (if the app has a login)
- Actions per user (if the app has a login)
Get Started
To use Fliplet Analytics you’ll need to:
- Enable the analytics
- Publish your app
How to use Fliplet Analytics
- How to use the timeline chart
- How to use the app metrics
- How to use the most popular screens
- How to use the interactions per screen
- How to use the most active screens
- How to use actions per user
- Disable Fliplet analytics
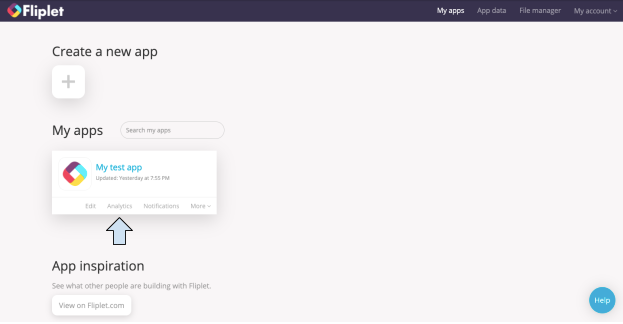
Step 1 – Open Fliplet Analytics
Note: if Fliplet Analytics is already enabled, proceed to 2.
- To enable Fliplet Analytics, open “Analytics” on your app and you will be prompted to set it up. There’s a button that says “Enable analytics”.
-
After enabling the analytics, make sure to publish the app to start the data tracking.
Step 2 – How to use the timeline chart
-
The timeline chart towards the top of the screen shows Active devices, Sessions, Screen views, and Interactions. Active devices is the total number of devices that have had the app installed and opened at least once during the selected time range. The other metrics are discussed in more detail below.
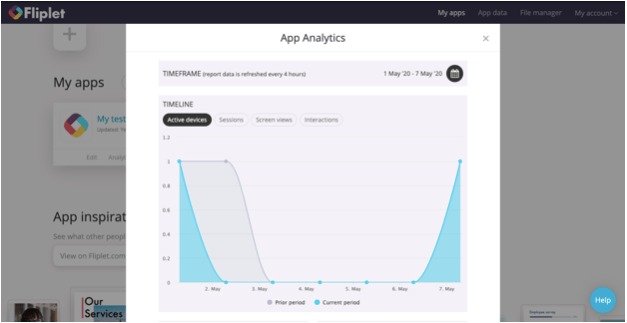
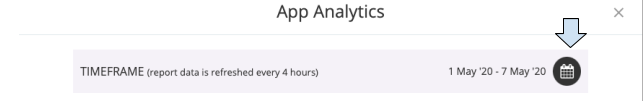
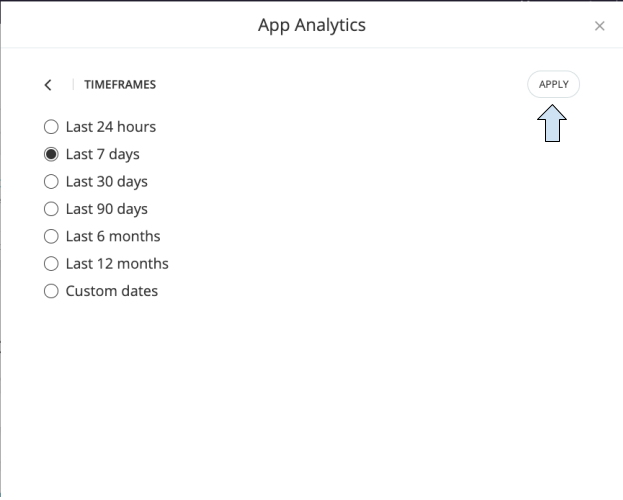
- If you wish to change the timeframe that the data was collected over, click on the calendar icon in the top right corner of your screen. A window will open that allows you to choose between different lengths of time, or you can set a custom time period. When you are finished setting the timeframe, click the “Apply” button to apply the changes.
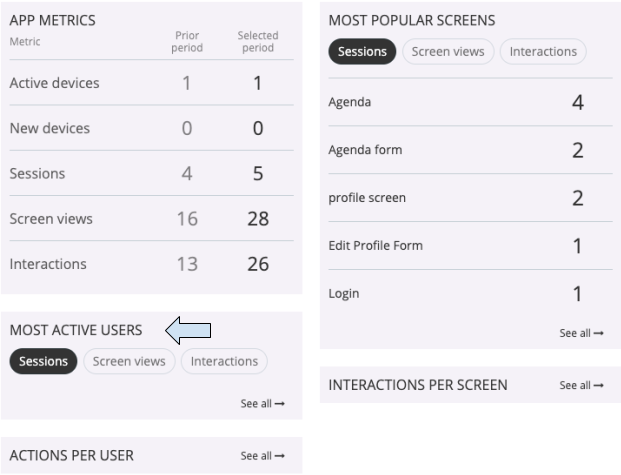
Step 3 – How to use the app metrics
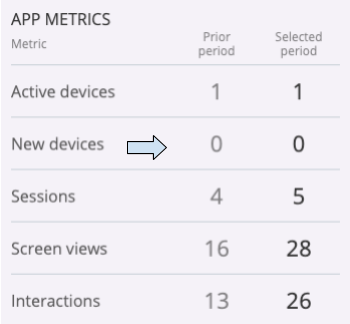
- Directly below the timeline graph on the left, you will see the App Metrics section. The second metric from the top is New Devices.
You will be able to see data from both the timeframe you selected and the prior period.
New Devices represents the total number of new devices that installed the app and opened it at least once during the specified time range.
-
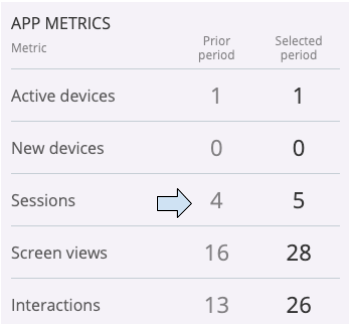
Directly below the New Devices is your data for Sessions. A session refers to the time a visitor actively engages app. A session initiates when a user either opens your app in the foreground or views a page or screen and no session is currently active (e.g. their previous session has timed out). By default, a session ends (times out) after 30 minutes of user inactivity. Analytics calculates the number of sessions that occur by estimating the number of unique session IDs.
- Next is Screen views. The Screen views data represents the total number of screens that were viewed during the specific time period. These are tracked by calculating transitions from one screen to another. When a screen transition occurs, Analytics logs a screen view event that identifies the new screen.
- Interactions are the number of actions taken by users in the app to interact (click, open, tap) with a specific element on the screen. An action could be clicking on a link. This tells you whether your app is drawing people to interact with it. For example, if you have very low interactions, you would maybe want to think about redesigning parts of your app so they are more user friendly.
Step 4 – How to use the most popular screens
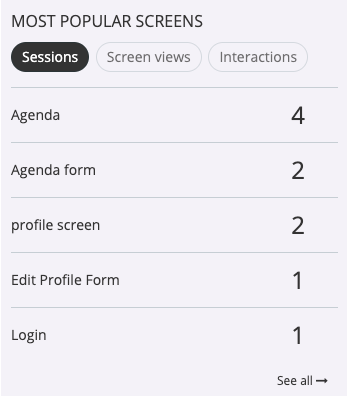
- Directly to the right of the App Metrics is the Most Popular Screens section, where you can view the most popular screens by session, screen views, or interactions. The Most Popular Screens section can help you further pinpoint which screens on your app are attracting the most interest from users so that you can focus on improving the other screens that are not on the Most Popular Screens list.
Step 5 – How to use the interactions per screen
- Directly under the Most Popular Screens section is the Interactions per Screen section. Click on the “See all” text to view interactions for different screens. A window will open that looks like this:
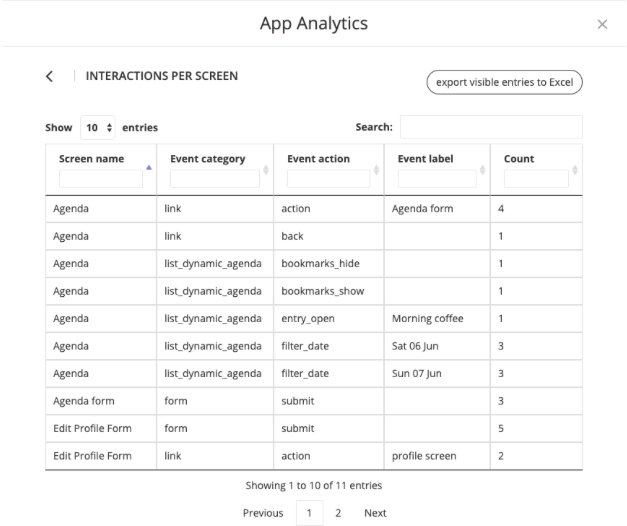
You can view the different actions that were taken on a specific screen and how many times each action was taken. This provides an even more detailed view of the different ways that users are interacting with your app.
Step 6 – How to use the most active users
- Next is Most Active Users. In order to track which users are the most active your app must have a login. You can view Most Active Users by Sessions, Screen Views, or Interactions. Click “See all” to get a better view of your app’s most active users.
Step 7 – How to use actions per user
- Click “See all” to get a better view of the actions per user. The most active users and actions per user sessions can help you target offers to specific people based on their interactions with your app. For example, if you see that a particular user is extremely active on your app and is regularly taking specific actions, you could reach out in a personal email to thank them for using your app, offer them a benefits program related to the app, or ask them to write a review of your app that you then post on your website. Fliplet Analytics is a powerful tool that can provide you with the data you need to make improvements to your app and develop the most successful app possible.
Disable Fliplet Analytics
- Open the “App Settings”
- From the menu at the top choose the “Add-ons” tab
- Click on the blue “System: Analytics” text
- Click the red “Disable add-on” button
Related Articles