Analytics is automatically enabled on all Fliplet apps. Data is refreshed every 4 hours, and you can view your analytics anytime in Fliplet Studio by clicking the Analytics button below your app name.
Get started
- Review session data
- Monitor returning devices
- Understand platform usage
- Analyze communication and engagement
1. Review session data
The following metrics help you track general app usage:
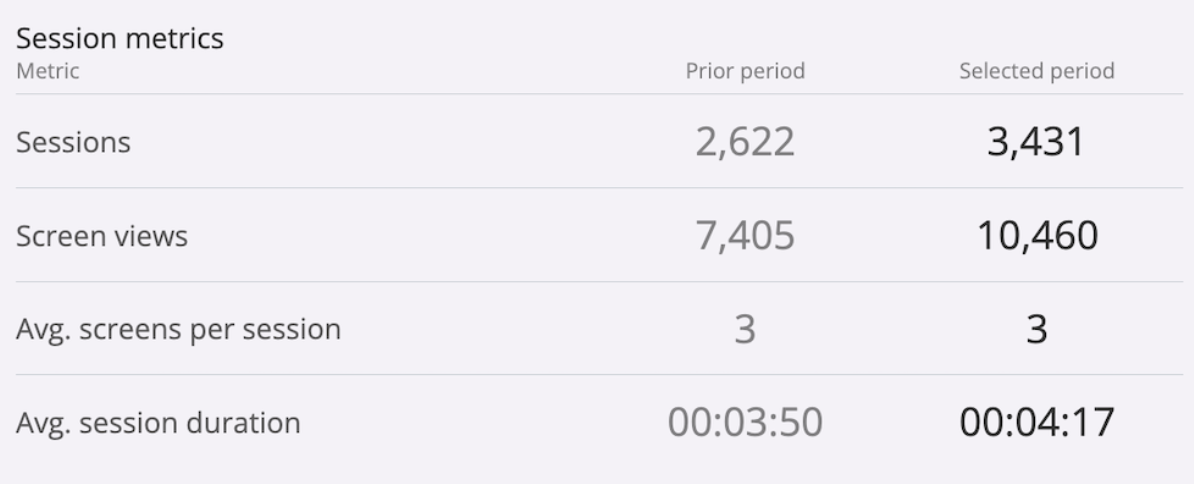
- Session Count: Total number of sessions within a specific timeframe. Helps track overall engagement.
- Average Session Duration: Shows how long users typically spend per session. (Displayed in graph)
- Average Screens Per Session: Average number of screens viewed in each session.
How these are calculated:
- Average screens per session =
totalPageViews / totalSessions - Average interactions per session =
totalEvents / totalSessions - Average session duration =
total session duration / total sessions
2. Monitor returning devices
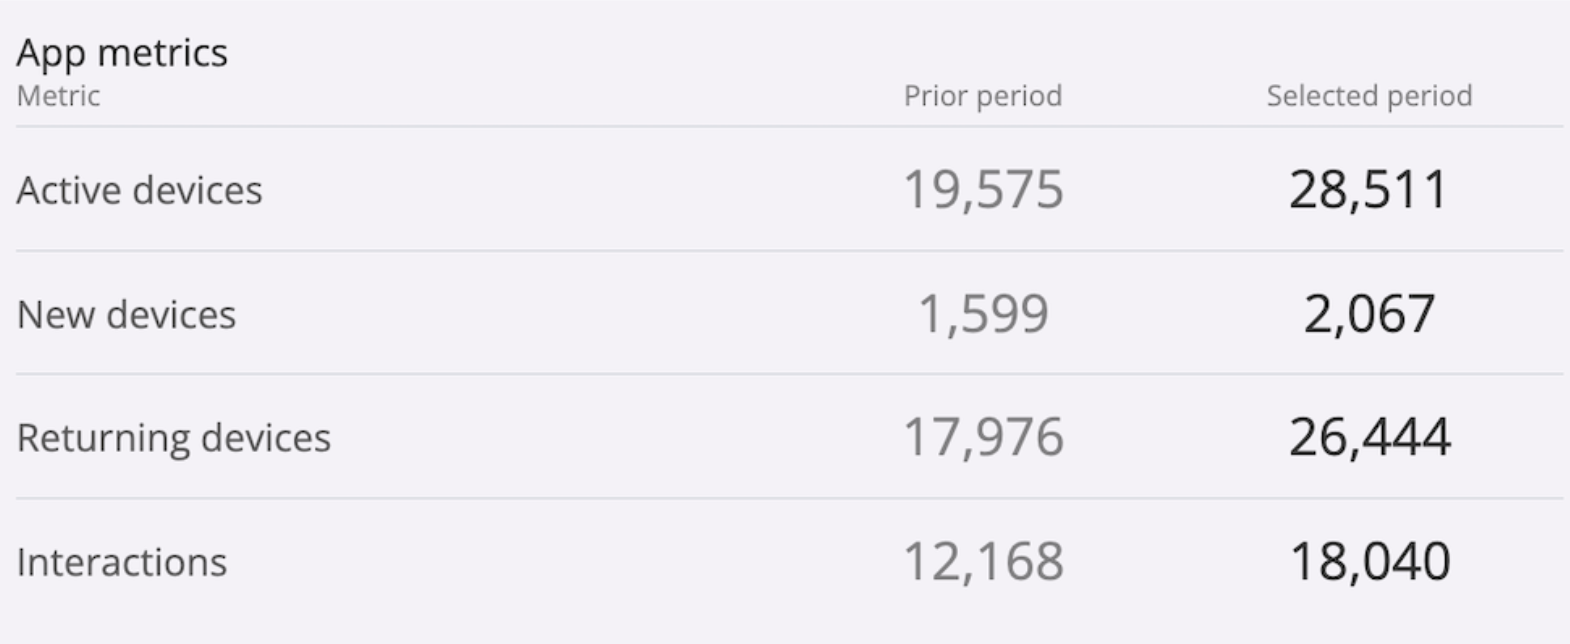
Definitions:
- New devices: Count of unique devices during the selected date range.
- Returning devices:
totalDevices - uniqueDevices
3. Understand platform usage
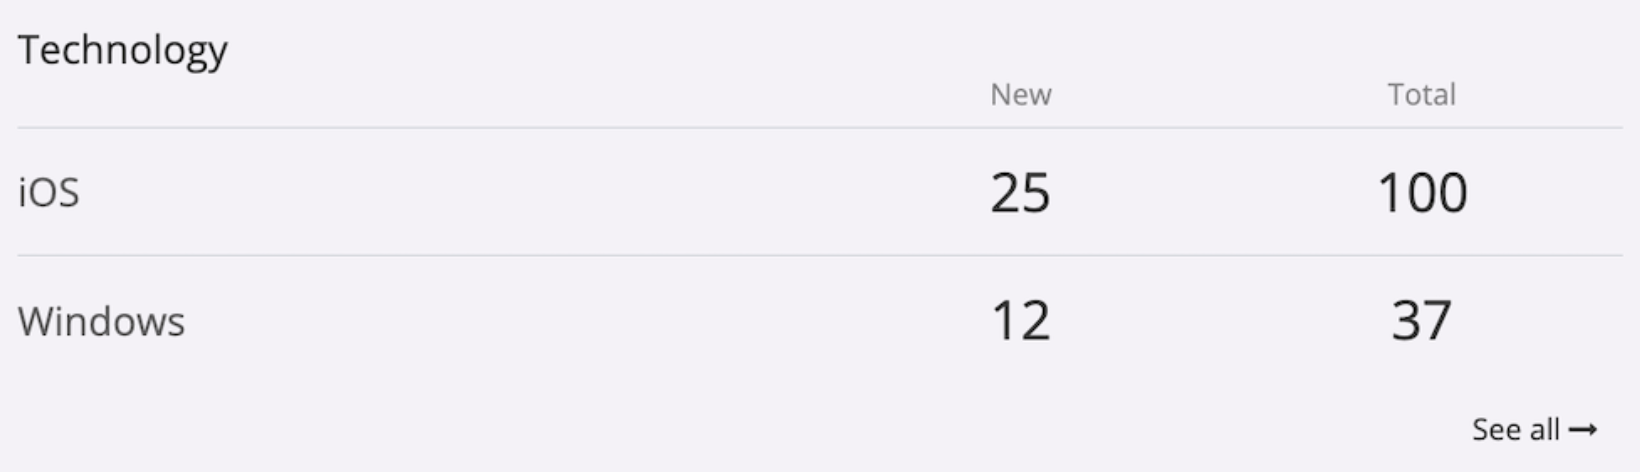
- Web app: Total and new devices using the web version
- iOS app: Total and new devices using the iOS version
- Android app: Total and new devices using the Android version
4. Analyze communication and engagement
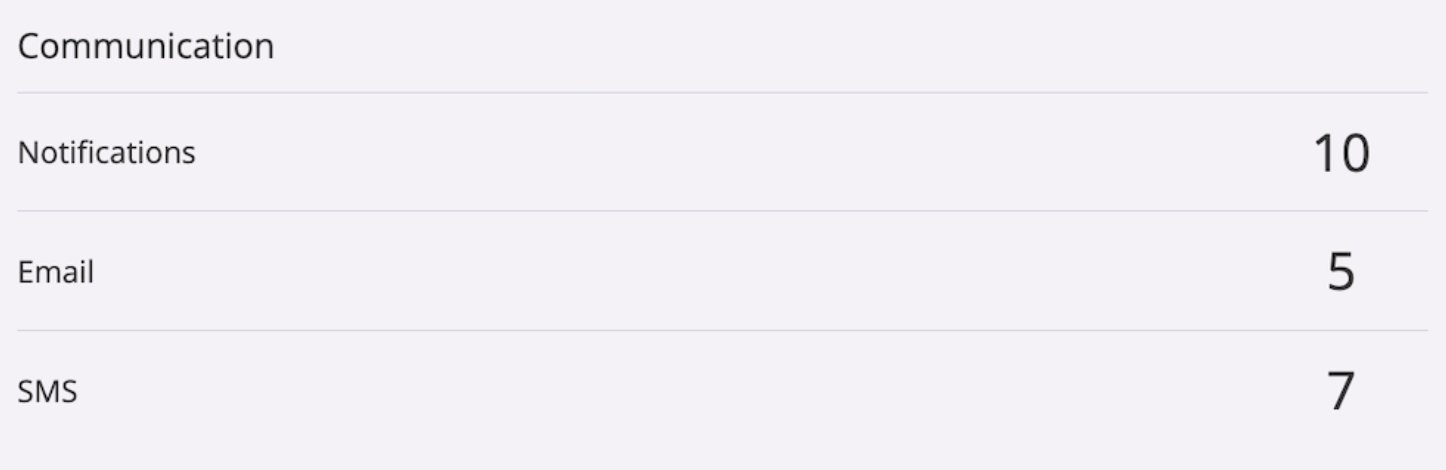
Communication metrics:
- Notifications: Number of notifications sent
- Email: Number of emails sent
- SMS: Number of SMS messages sent
User engagement metrics:
- Active devices: Devices that installed and opened the app during the selected timeframe
- New devices: Devices that installed and opened the app for the first time during the selected timeframe
- Screen views: Total screens viewed during the period
- Interactions: User actions like taps, clicks, or menu usage
- Most active users: Top users based on interaction volume (login required)
- Actions per user: Total number of actions performed per user (login required)
- Most popular screens: Frequently visited screens, filterable by session count, views, or interactions
- Interactions per screen: Breakdown of user actions on individual screens (e.g., clicks on news items)
You can disable analytics at any time by going to your app’s settings, selecting Add-ons, and disabling the System: Analytics option.
Related Articles
Was this article helpful?
YesNo